Skip to content

Anxious Door

An internet of things, artificially intelligent art project by Snow

Anxiety mood graphs

24 hours

7 days

3 weeks

Graphs indicate the anxiety rating over time. The rating is a calculation based on news articles from the last 3 weeks. More recent news has a greater effect than older news. The red line indicates the 3 week mean - scores above that line lock the door.

Recent Posts

  • ConceptNet 5 released
  • Vinco lock modification.
  • Background Briefing – 27 June 2010 – Social media and sentiment mining
  • Updates to door
  • laptopd: Python script to control laptop behaviour

Categories

Feeds

  • Door news feed
  • Twitter feed

NLP

  • ConceptNet 2.0

Reading

  • Anxiety in a Risk Society
  • Architecture of Fear
  • False Alarm: The Truth About the Epidemic of Fear
  • Flat Earth News
  • Generalized Anxiety Disorder
  • Good News, Bad News: Journalism Ethics And The Public Interest
  • The Trial
  • Violence

Related news

  • A pandemic of human fear and anxiety
  • Climate of Fear [the Age]

Related objects

  • A Tool to Deceive and Slaughter (2009)
  • Emotive faces and the news
  • Empathic network visualisation
  • Global Anxiety Monitor
  • Newstweek
  • Self healing chair
  • The Reverse Geocacheā„¢ Puzzle Box
  • The Wave Pillow
  • Weather detecting umbrella

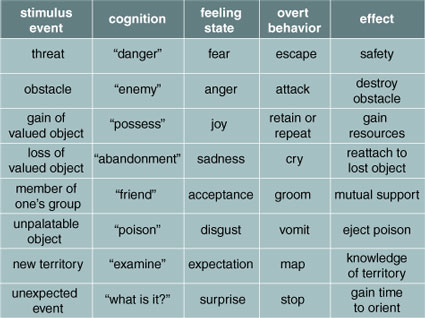
Robert Plutchik’s eight basic emotions

anger, fear, sadness, disgust, surprise, curiosity, acceptance, joy

American Scientist

Posted on October 14, 2007October 14, 2007Author mr.snowCategories UncategorizedTags linguistics

Post navigation

Previous Previous post: Penn Tagset
Next Next post: Software combination
Proudly powered by WordPress